Introduction
NVivo is a computer software analysis programme that supports qualitative and mixed methods research data. The programme allows you to organize, analyse and draw conclusions/find insights when using unstructured or qualitative research methods to generate your data (interviews, documentary analysis, open-ended survey’s, ethnography/observations, research articles, social media content and web content etc.).
NVivo is designed to make qualitative data analysis less time consuming, less challenging to manage and easier to navigate. It allows you to store and manage your data efficiently and keeps the data in its original format (even after it has been coded and analysed). It also allows you to analyse your data in several ways allowing for a more detailed analysis to be developed and a greater understanding/interpretation of your data to emerge.
As it is a computer programme it also allows your research to become portable, for example, when working in the field you can instantly input data to NVivo.
Downloading NVivo onto your device
To get started, please download NVivo onto your device by going to the UHI website here https://www.uhi.ac.uk/en/lis/software-downloads/nvivo-home-use/.
You will require an installation key, you should open a support ticket via https://uhi.unidesk.ac.uk/ from your university email account (student number@uhi.ac.uk) and ask for an Nvivo software license key.
Approaching Data Analysis – Prior to Starting NVivo
Remember that researchers (regardless of the discipline) must follow the research cycle in order to increase the validity and reliability of their work. Analysing qualitative data is similar to this in that you follow a ‘data analysis’ cycle (which also helps increase the validity and reliability of your work). Following the cycle allows you to remain focused and can help prevent any duplication of your coding.
Below is an example of a data analysis cycle which has been taken from the ‘Nvivo 11 Getting Started Guide’ and will help you work towards your own data analysis (QSR International, 1997-2017, p7):
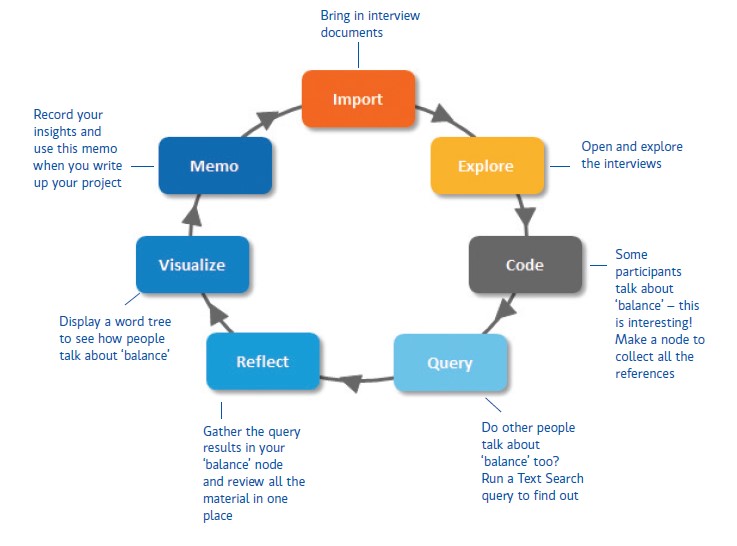
Please remember that Nvivo is only as good as its user – it cannot do all the work for you.
Starting NVivo
Before going any further it is important that you familiarise yourself with some of the key concepts that you will be using:
- Data: This is where any materials you are using for your research is stored. This can include materials such as PDF’s, documents, memo’s, datasets, audio, video and pictures.
- FileClassification: This allows you to record information about the sources you have stored. It could be for information such as bibliographical data, or, annotated bibliography.
- Coding: This is where you begin to process your data and identify topics, themes or cases. It could be, for example, through selecting a paragraph on young people and crime which you code as ‘youth crime’.
- Nodes: This is where your coding that relates to themes, topics or any additional concepts you develop, are stored. This allows you to add material to your code which will allow you to look for any emerging themes, patterns or ideas.
- Cases: This is an additional storage place for your coding, however, rather than being organised by themes or topics, they are organised by ‘units of observation’. This can include, for example, people, organisations, and places.
- Case Classification: As with source classification, case classification allows you to record information about your cases. This could include, for example, demographic information about the people, or organisations you are researching.
(QSR International, 1997-2017, p6)
To start Nvivo, go to the start start menu on your computer or laptop and click on ‘QSR’ – a menu will drop down which contains the following options:
- Nvivo 12 - this will start Nvivo
- Nvivo 12 Tutorials – this will take you to a website with short tutorial videos (this first one is 1 minute long), you can click on the arrows at either side of the tutorial video screen to access more.
- QSR – this will take you to the main QRS website, where you can find out more information on Nvivo products.
Click on ‘Nvivo 12’ (you may have a short cut on your desktop which you can also use). This will open Nvivo and take you to the main start screen (see image below).
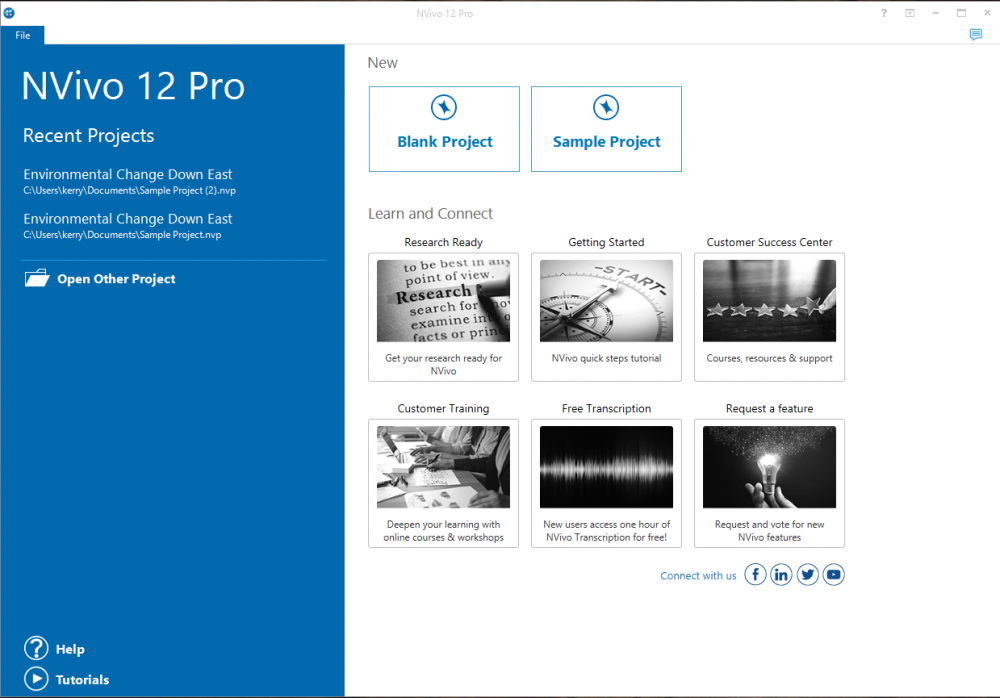
You will notice that there is an option for ‘Blank Project’ and ‘Sample project’. The sample project contains different types of data (interviews, photographs, recordings etc.). This is to allow you to go in and practice using the software, without impacting your own data (a safe place to learn).
The video below demostrates how to create a new project in Nvivo:
You will see that NVivo has been designed to be similar to Microsoft Office Word, this is to make it more user friendly and easier to navigate.
Saving your work
NVivo is set to produce a pop up box every 15 minutes to remind you to save your work – this is a great part of NVivo as it is very easy to become emerged in your work for hours and you are likely to forget to save. This way, there is no danger of forgetting or losing work.
Setting up NVivo
The followng video demostrates how to upload data into NVivo:
Your data is now uploaded and ready for analysis.
The following video will demostrate how to access the sample project, where you will see that the NVivo start screen for the sample project already has the data uploaded:
Organising your data
In order to organise your own data (in your new project), you can right click on the ‘Files’ folder from the list on the left-hand side (in the 'Data' section) and click ‘new folder’. You can then give this folder a name to identify the data contained there. When uploading your data make sure you have selected the correct folder from your files list before uploading.
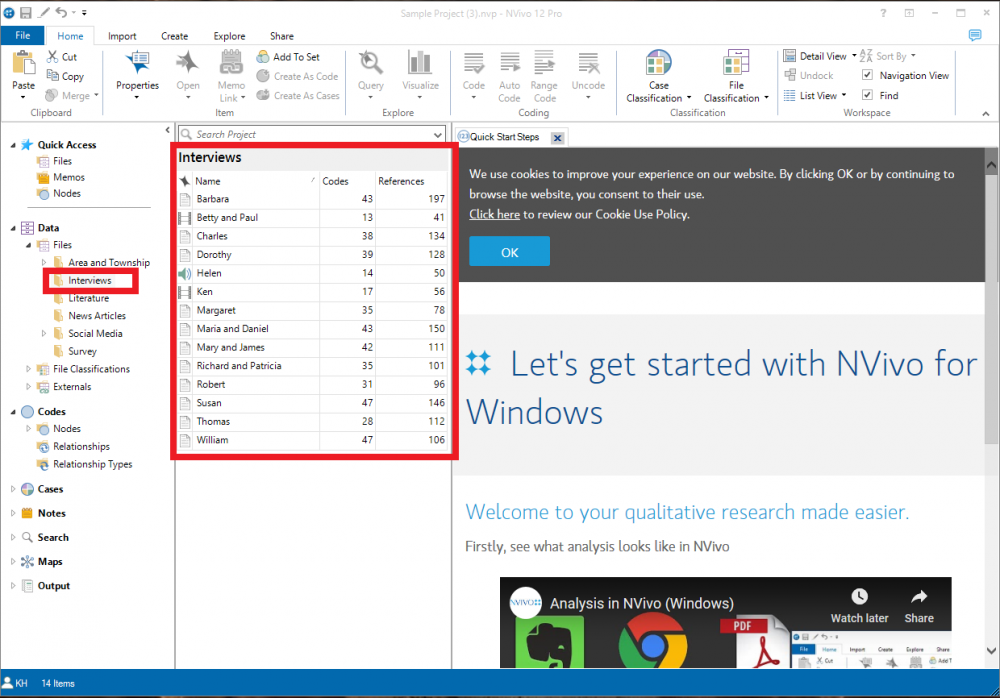
In the sample project you will see that they have organised their internal section by data type:
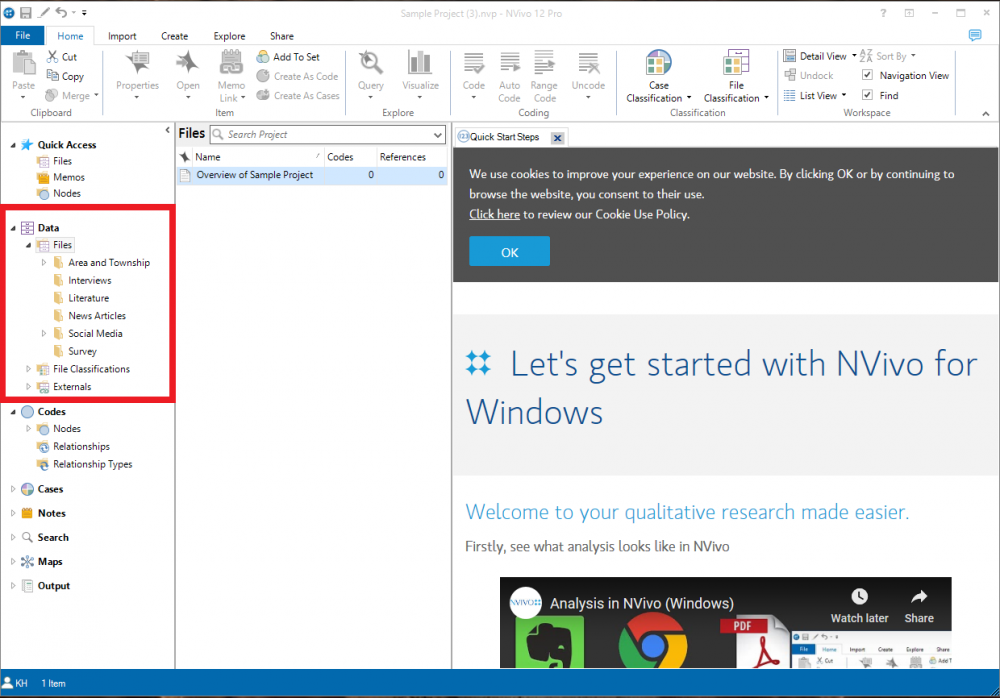
We are going to work with ‘Interviews’, click on this from the list of options, you will see that the middle pane now contains all the data stored in the interviews folder:
Working with Data in NVivo – Coding
There are numerous ways to approach your coding. The approach you take is typically determined by your chosen methodology and research design. Below are some suggestions on how you may approach your coding:
- ‘Start with ‘broad-brush’ coding to organize the material into broad topic areas (you can use Text Search queries to help with this)—then explore the theme node for each topic and do more detailed coding. For example, gather all the content about water quality and then explore the theme node looking for interesting perceptions, contradictions or assumptions.
- Or, you could get straight into detailed coding (making theme or case nodes as you need them) and then, later on, combine and group your nodes into related categories.
- As you reflect on a piece of content, think about these different types of coding:
- Topic coding—What is the topic being discussed? For example, water quality, real estate development, tourism and so on.
- Analytical coding—What is this content really about? Why is it interesting? Consider the meaning in context and express new ideas about the data.For example, ideals vs reality, tension between developers and residents.
- Descriptive or case coding—Who is speaking? What place, organization or other entity is being observed?’
- (QSR International, 1997-2017, p32)
Whilst the focus here is on interviews, the same approach should be taken when working with other types of data (the more you work with NVivo the more confident you will become and you can begin to familiarise yourself with the additional analysis options that are available).
Coding – after documents have been uploaded
To access the data double click on the appropriate document, you will see that the transcripts opens on the screen for you. First of all, read through the transcript to make sure you know the content, then you can begin to code. The video below demostrates how to code in NVivo:
Your new code will be stored in the ‘Codes’ area, under 'Nodes' (see below):
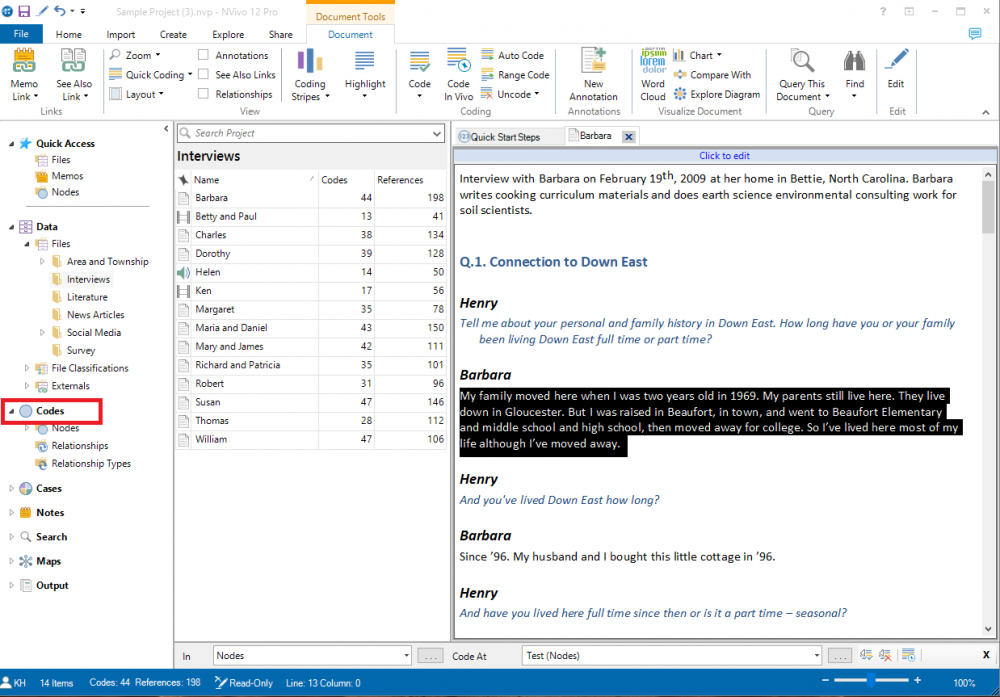
The next time you code information, when you right click you will have the option to save it under an existing code, or, create a new code.
If you click on ‘Nodes’ you will see a list of your codes appear in the centre window (see below):
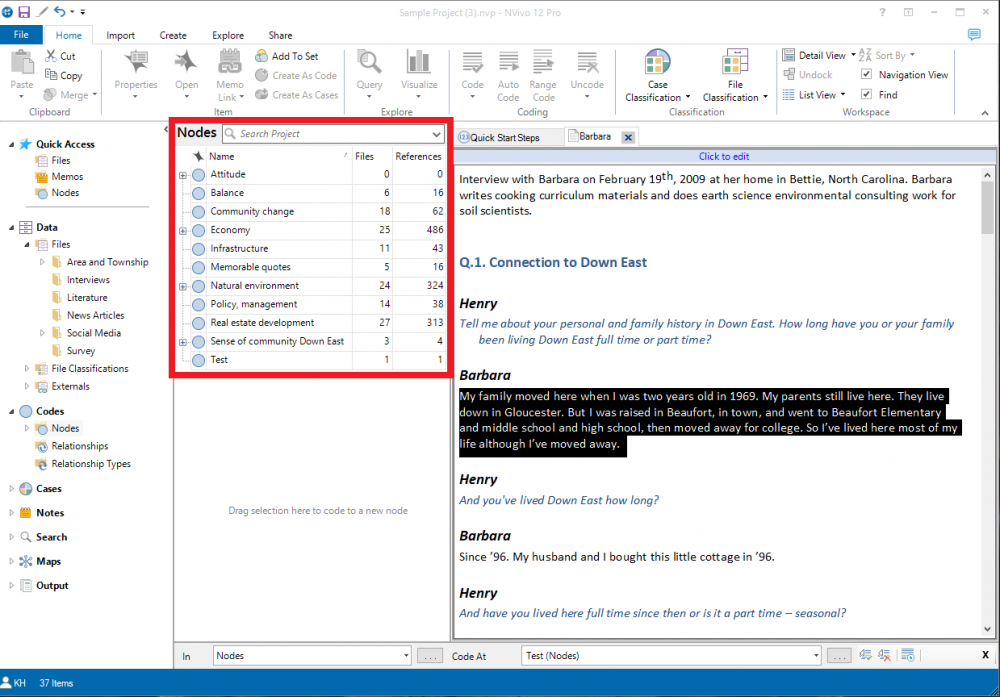
In the centre window, under 'Name' is the list of codes you have developed. Under 'Files' is the number of different data sets (transcripts) that have been allocated this code. Under 'References' is the total number of sections (pieces of information) you have allocated to this code (all sources combined).
When you go into your nodes you will find that all the material you allocated this code are stored in one place. This allows you to analyse the data without it being mixed in with irrelevant information or addition information unrelated to your code. You are now ready to reflect, analyse and further code your data (please see section on 'Working with Data in NVivo – Nodes' for more information).
Coding – before documents have been uploaded
If you already know the themes you are going to be using for your coding (either through instruction, based on your literature review, or based on themes that emerged from previous data analysis), you can set up your codes prior to uploading your data. Please see video below:.
Your new node will be stored in the Node section in the same way as the coding in the previous section.
Working with Data in NVivo – Nodes
In the list of nodes double click on the node you would like to analyse, I have selected the ‘Economy’ code to use in this guide. The following details will be displayed:
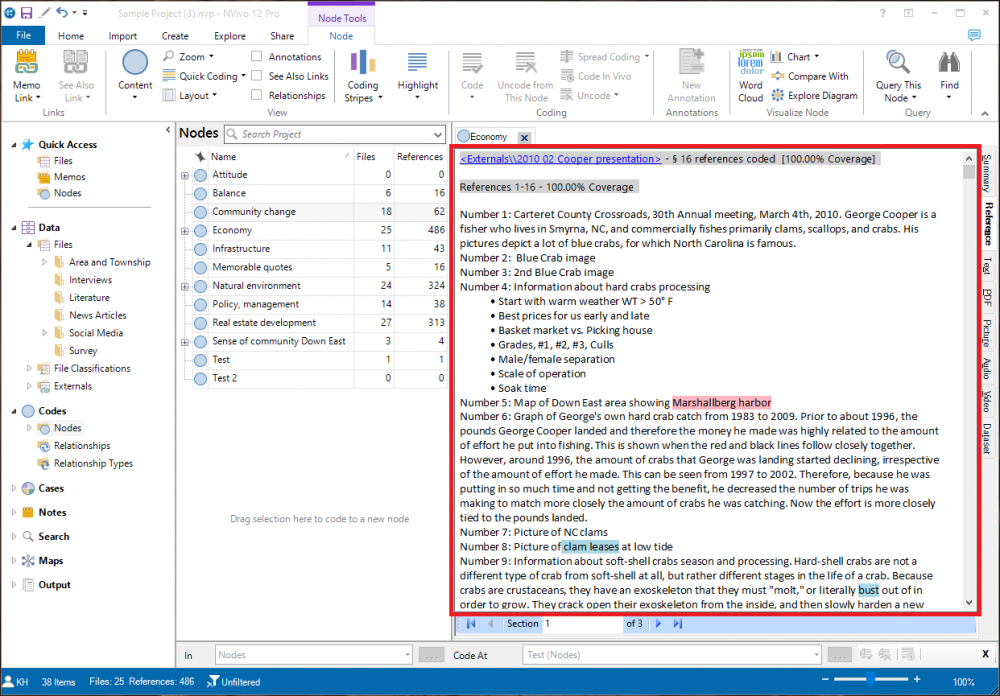
Have a look at the tabs on the right-hand side:
- The ‘Summary’ tab provides a list of all of the data (sources) stored for this code and the number of times they have been used:
- The ‘References’ tab contains all the extracts/content you have included in this code (all sources combined).
- The ‘Text’ tab contains all the text you have stored in your code (e.g. transcript material). You will see there are two sections. The first contains the documents used and the number of times they were used. The second contains the material that was taken from each source:
Work your way along the first section, clicking on each document. The content from the document, which you coded, will be displayed in the second window. You will see that NVivo has numbered the coding for each document. This is to allow you to see how many times your coding was referred to in each document. This means you can identify data where the topic is mentioned frequently (suggesting it is important to the interviewee) and content which is referred to less frequently (suggesting it is not as important to the interviewee).
The remaining tabs, ‘PDF’, ‘Picture’, ‘Audio’, ‘Video’, and ‘Datasets’ contain any additional data you have stored and applied your coding to. This allows you to develop a greater understanding of how your data relates to your coding, and allows you to analyse your data sets holistically or individually. As this is an introductory guide, however, we will not be focusing on these.
Please see the video below for futher guidance:
Memos, Annotations and Links
It is possible to add notes to your data sets and coding’s. This is useful when working on your own data as you can flag up ideas or take notes of your thought process. They are only effective if you use them from the start.
We will not be covering them here as this is a short introductory guide, however, below is an extract from the ‘Nvivo 11 Getting Started Guide’ to give you an idea of what they can be used for:
You can use memos to tell the story of your project—from your early ideas and assumptions to fully-fledged insights about a topic, person, or event. Use them to ‘talk to yourself’ as you make sense of your data.
‘Tracking your analytical process with memos can help you to increase the transparency and reliability of your findings. With your process recorded in memos, you can easily demonstrate the evolution of a theory or quickly call up data that supports client questions.
Memos are quite ‘free form’ in NVivo and our innovative users (from the LinkedIn NVivo Users Group) have come up with some great uses for them:
- Project memo—record your goals, assumptions and key decisions. Like a journal, update it regularly and include links to the significant theme nodes and sources. Bring your journal to life by displaying it in a project map.
- Interview or participant memo—summarize the key points of an interview. Make note of contradictions, surprises or early hunches. Include ideas about the theme nodes you might make and include photos or descriptive information about the interview setting.
- Node memo—explain why you think a theme is significant (especially useful in team projects). Add to the memo as your thinking evolves and include links to the related literature. By writing as you go, you won’t face the pressure of staring at a blank document when it comes to writing up your project.
- Query results memo—what do these query results tell me? Make a memo to organize your ideas and to plan future steps. If you display your query results in a chart or other visualization, copy and paste it into the memo.
- Analytical and procedural memos—record your findings in analytical memos and use procedural memos to document the methodological steps you take.
- NVivo memo—record what works best in the software, including any tips or shortcuts you want to remember. Include links to NVivo-related support materials that you’ve found on the web. ‘
(QSR International, 1997-2017, p38)
Working with Data in NVivo – Queries (analysis)
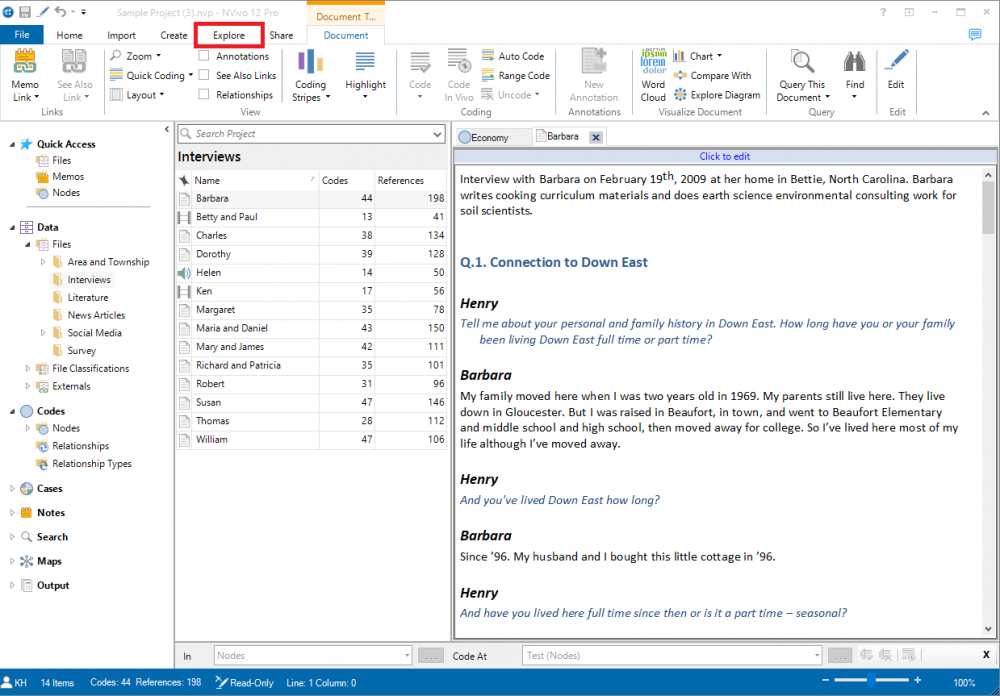
The ‘Explore’ section in NVivo allows you to bring your data together and start analysing from different approaches. You can analyse specific words or phrases that appear in your sources, the codes/nodes you have developed, as well as cases and relationships (if you have developed these).
To access the ‘Explore’ section, click on the tab at the top:
This will take you to the following page, note the different option along the top:
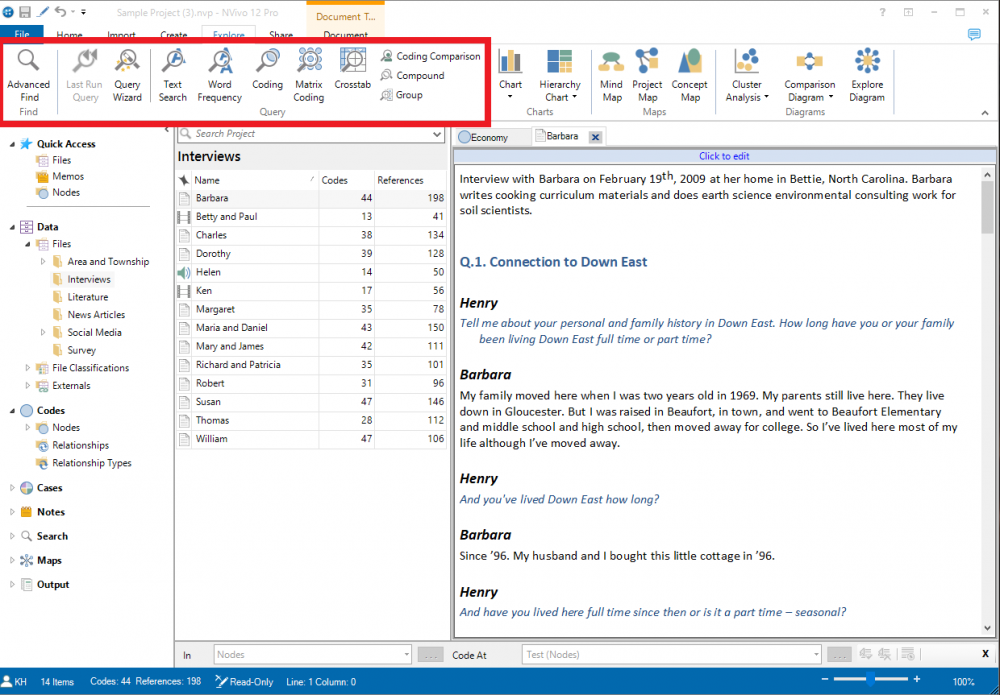
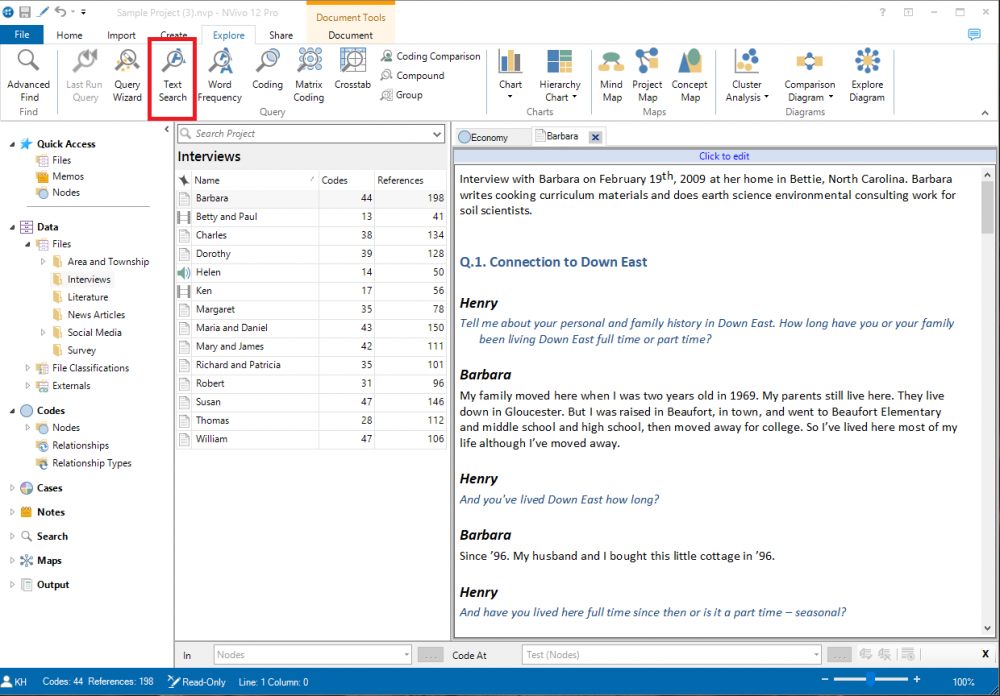
Text Search
If you want to search for a word or phrase, use the ‘Text Search’ function (I will use the word 'Economy' here):
Once you have run your text search, you will see the following results (similar to the nodes results):
- Summary
- references
- Text
- Video
- Datasets
- Word tree
You will now see the additional of a different tab ‘Word Tree’. If you click on this you will get a visual representation of the word or phrase you have searched for, along with an indication the words or phrases it is linked to. You can use the word tree to help you analyse the strengths of your nodes (codes) and words linked to them, which can help you merge nodes where there are possible duplications. It will also help you understand the context in which the word was used, which will help you develop your themes.
Please see video below for a demonstration on how to use the text search function:
Word Frequency
If you do not know the key words or phrases you can do a word frequency search, which will search your sources and identify recurring key words or phrases they contain.
Click on ‘Word Frequency’:
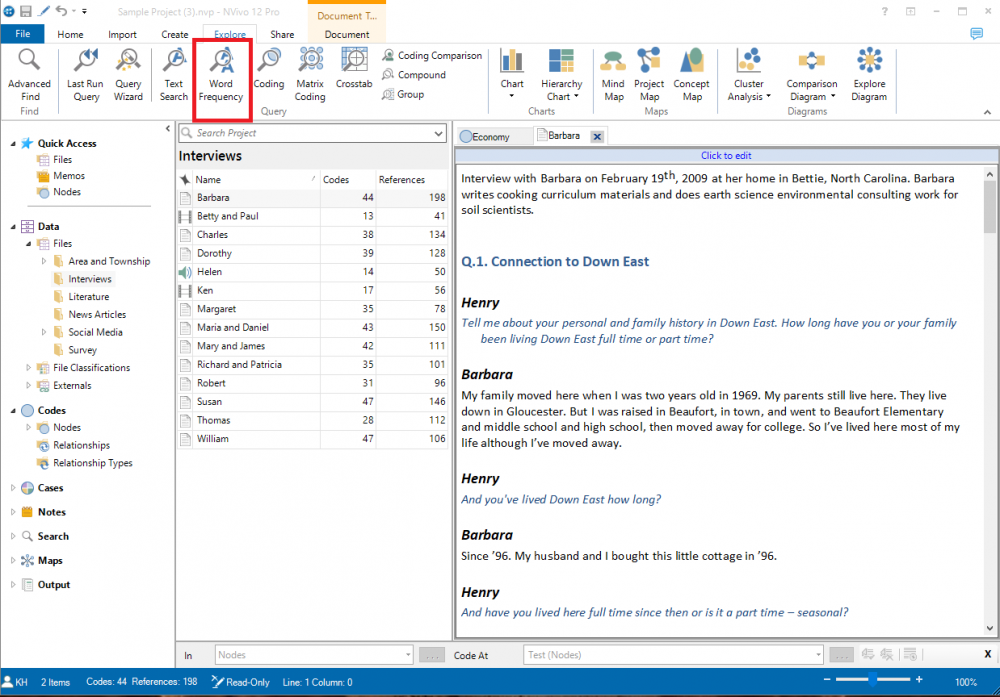
You can select the type of search you would like to run – sometimes an exact match search can produce little results, it is better to select ‘with generalisations’ to allow a more thorough search to be carried out. Once you have run your search you will see the following results:
- ‘Summary’ – lists the words that were found and the number of times the word occurred in the sources, as can been seen in the image above.
- ‘Word Cloud’ – Provides a visual representation of the words identified
- ‘Tree Map’ – is an alternative visual representation but it is more complicated to understand’
- ‘Cluster Analysis’ – is another alternative visual representation
Please see video below for a demonstration on how to use the word fequency function.
Word Cloud
The Word Cloud is a good way to identify key words and is easier to understand (the bigger the word, the more it occurred). This can help you identify commonalities which, in turn, help you identify your themes for coding.
If you are comfortable working with NVivo and are familiar with your data and coding there are additional options, including (but not limited to):
- Coding Query – you can identify which ‘Node(s)’ you would like analysed, rather than all of your sources
- Matrix Coding Query – you can specify your search criteria here (be more specific). You can identify which word or phrase you are looking for and where, in your source/coding/classes, you would like to search.
Working with Data in NVivo – Visual Representation of Data Analysis
As well as text analysis, NVivo allows you to analyse your date using charts, graphs and alternative visual analysis. This is a quick way of identifying trends and trying to make sense of your data. The charts and graphs produced can also be used when writing up your final report to highlight the finding from your data.
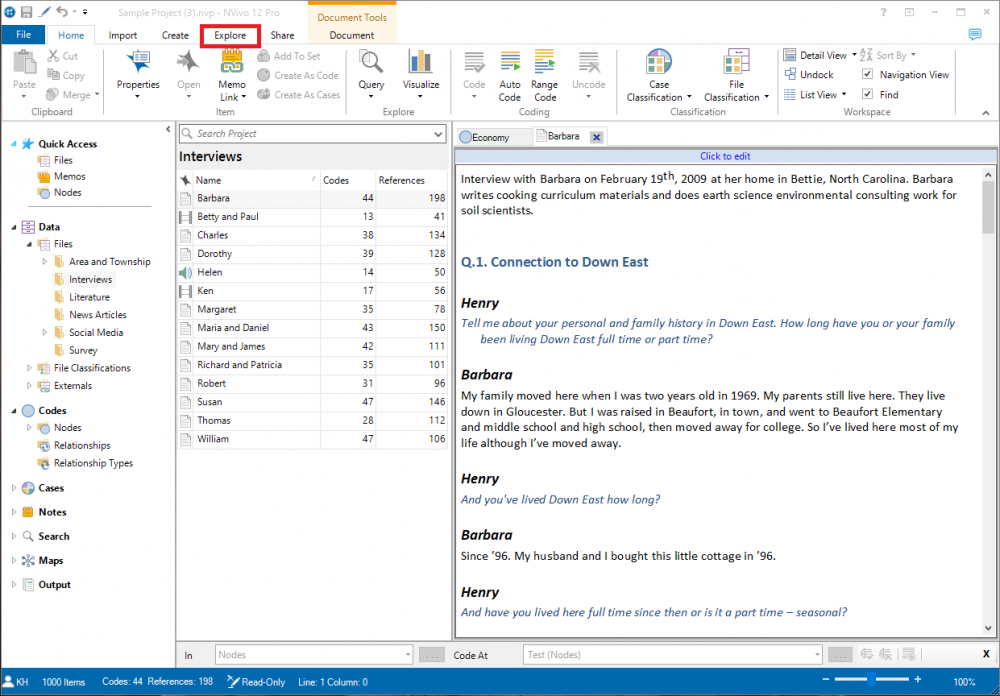
To create your charts and graphs click on the ‘Explore’ tab at the top of the page:
This will take you to the following page, note the different option along the top:
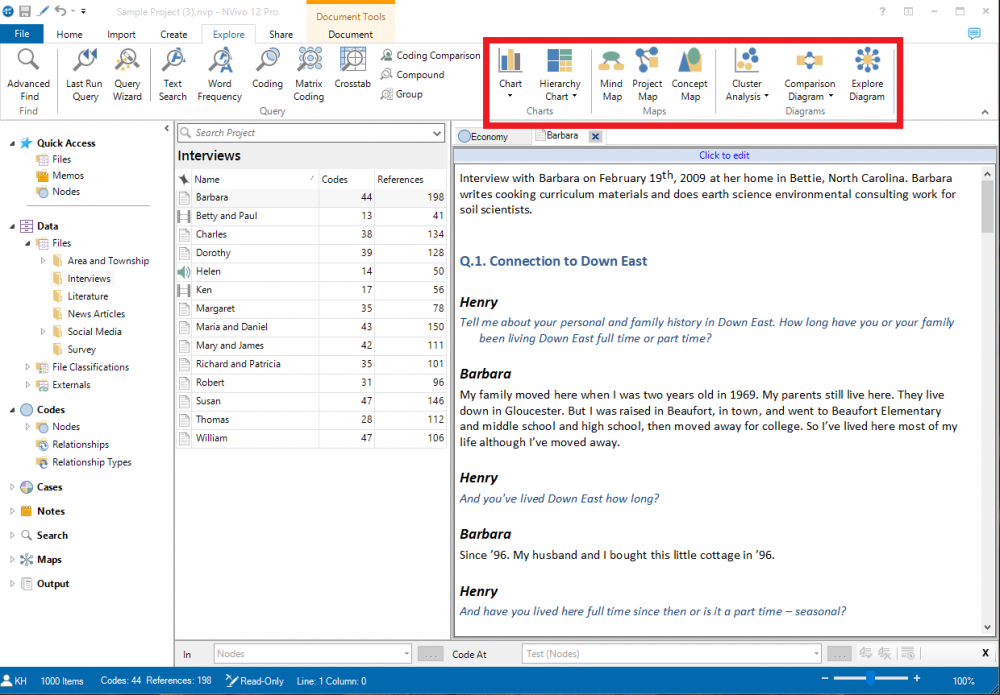
If you work your way along the options, you will see a dialogue box opens for you to specify what it is you would like to be analysed. Your choice of graph or chart will depend on the information you are looking to analyse or present. Your result will then be shown in the right panel of your page along with additional options for your specified chart or graph, as with the video example below:
Success
You have now worked your way through the basics of NVivo. The more confident you become the more you can make use of the additional options that are available. Remember NVivo stores everything in specific places, leaving your data in its original format – this allows you to re-trace your steps, or, start a new project using a different approach. Also remember that there is a sample project available for you to practice with.
All that is left for you to do is interpret your findings and draw conclusions (which NVivo cannot do for you).
Reference
QSR International, (1997-2017), ‘NVivo 11 Pro for Windows, Getting Started Guide’, Version 114 [online], Available from < http://download.qsrinternational.com/Document/NVivo11/11.4.0/en-US/NVivo11-Getting-Started-Guide-Pro-edition.pdf> [9th February 2017]
